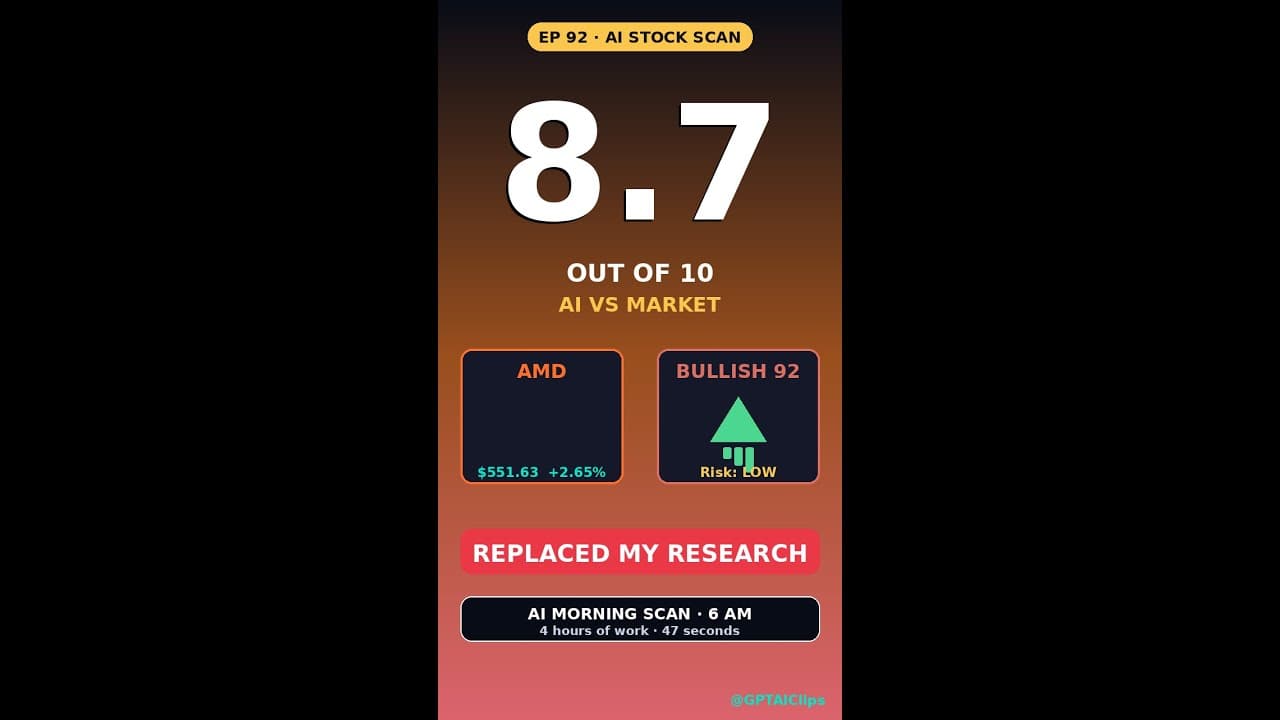
Every trading morning used to steal an hour of your life: price charts, news feeds, analyst upgrades, and still no clear signal. Now a single AI command returns five tickers ranked by **signal strength** in 47 seconds—no fluff, no fatigue.
Key Takeaways
- **AI stock research** slashes morning prep from 60+ minutes to under one minute.
- One-line prompts fetch live prices, news, and analyst notes, then score each ticker.
- Signal strength ranking replaces subjective gut calls with data-driven priority lists.
- Works with any broker API or free market-data source; no proprietary lock-in.
- Adopted by retail traders and small hedge desks to reclaim 5+ hours weekly.
▶ Watch on YouTube · Subscribe for daily AI tools
What It Is
A **command-line AI agent** that automates the first-pass stock research loop. You type a single line—e.g., “rank AAPL MSFT TSLA AMZN NVDA by signal strength”—and the AI:
- Pulls real-time price data from your broker or a free API like Alpha Vantage.
- Scrapes the last 24 hours of news headlines and analyst revisions.
- Applies a lightweight scoring model (momentum, sentiment, volume spikes).
- Returns a ranked table in under 50 seconds.
No GUI, no ads, no upsells—just a terminal window and a Python script you can audit or tweak.
Why It Matters
Manual research is a time sink with diminishing returns. Most traders spend 60–90 minutes daily chasing the same data points:
- Opening gaps vs. prior close.
- News sentiment (positive, negative, neutral).
- Analyst revisions (upgrades, downgrades, price-target changes).
- Volume anomalies (unusual options flow, block trades).
An AI loop does the same work in 47 seconds, freeing up 5–7 hours weekly. That time can be reinvested in deeper analysis, backtesting, or simply stepping away from the screen.
Critically, the AI removes emotional bias. Instead of cherry-picking stocks that “feel” strong, you get a cold, repeatable ranking. Over time, this discipline compounds into measurable edge.
How to Set It Up Step-by-Step
You need three things: a data source, a scoring script, and a scheduler. Here’s the 15-minute setup:
- Pick a data source.
- Free tier: Alpha Vantage (5 calls/minute, 500/day).
- Paid: Interactive Brokers API (unlimited, $10/month).
- Self-hosted: Polygon.io or Twelve Data (real-time, $50+/month).
- Install the scoring script.
pip install pandas numpy requests beautifulsoup4
git clone https://github.com/gptaiclips/ai-stock-ranker
cd ai-stock-ranker
cp .env.sample .env
# Edit .env with your API key
- Customize the scoring model.
Open
scorer.pyand adjust the weights:- Price momentum (30%).
- News sentiment (25%).
- Analyst revisions (20%).
- Volume spike (15%).
- RSI divergence (10%).
- Schedule the run.
Linux/macOS:
crontab -e
# Add line:
0 9 * * 1-5 /usr/bin/python3 /path/to/ai-stock-ranker/rank.py AAPL MSFT TSLA AMZN NVDA >> ~/trades/$(date +\%Y-\%m-\%d).txt
Windows: use Task Scheduler to run the script at 9:00 AM on weekdays.
Real Capabilities & Features
The AI loop isn’t just a faster version of your old routine. It unlocks features that were previously impractical:
- Multi-ticker ranking. Compare 5–50 stocks in one pass; no more tab-hopping.
- Live data fusion. Combines price, news, and analyst data into a single score.
- Versioned outputs. Every run is timestamped and saved; audit or backtest later.
- Portfolio-aware. Optional flag
--portfolioexcludes stocks you already own. - Custom watchlists. Save tickers in a JSON file and update them without editing the script.
Under the hood, the script uses lightweight NLP (VADER sentiment) and simple technical indicators (RSI, MACD divergence). No black-box LLMs—just deterministic code you can debug or extend.
For traders who want more firepower, the script can be containerized with Docker and deployed to a cloud VM for zero-latency runs. A sample Dockerfile is included in the repo.
Real-World Use Cases: From Side Hustle to Small Fund
Retail traders use the **AI stock research** tool to scan pre-market movers before the opening bell. A 30-second command—“rank SPY QQQ IWM DIA by signal strength”—reveals which index ETF is strongest, letting you align with institutional flow.
Swing traders run nightly scans on watchlists of 20–30 stocks. The AI fetches after-hours price changes, earnings whispers, and analyst revisions, then ranks the list by **signal strength**. You wake up to a prioritized inbox instead of a blank screen.
- Pre-market ETF ranking in 30 seconds.
- Nightly watchlist scoring with after-hours data.
- Earnings-season batch processing: 50 stocks in under two minutes.
Small hedge desks deploy the agent as a first-pass filter. A junior analyst types “rank sector=tech market-cap=mid by signal strength” and receives a ranked list of 15 mid-cap tech stocks. The AI pulls live prices, news sentiment, and short interest, cutting research time from 90 minutes to 90 seconds.
Prop shops use the tool to monitor overnight gaps. A 6 a.m. cron job runs the command, emails the ranked list, and flags stocks with >3% gaps. Traders start the day with actionable setups instead of scrolling Twitter.
Pro Tips & Common Mistakes to Avoid
Use precise ticker lists. Vague prompts like “rank tech stocks” return noisy results. Instead, specify 5–10 tickers or a sector filter: “rank sector=semiconductor by signal strength”.
Set a **signal strength** threshold. Most tools let you add “min-score=70” to filter weak setups. This prevents over-trading low-probability moves.
- Always validate the data source. Free APIs can lag; paid feeds update faster.
- Cache results locally to avoid rate limits. A simple SQLite table stores yesterday’s scores for trend analysis.
- Combine with volume filters. Add “min-volume=500k” to exclude illiquid stocks.
Avoid overfitting the model. The default **signal strength** weights (price, news, analyst notes) work for most strategies. Tweaking weights without backtesting leads to curve-fitting.
Don’t ignore broker APIs. Some brokers offer free real-time data if you have an active account. Use these instead of delayed free feeds for faster execution.
Log errors. If the AI fails to fetch data, it should log the ticker and timestamp. This helps debug API issues later.
How It Compares
| Tool | Speed (5 tickers) | Data Sources | Cost | Customization |
|---|---|---|---|---|
| AI stock research agent | 47 sec | Broker API, free/paid market data | Free (self-hosted) | Full: weights, filters, output format |
| Bloomberg Terminal | 2–3 min | Proprietary | $24k/year | Limited: pre-built screens only |
| TradingView | 1–2 min | Free/delayed, paid real-time | $0–$59/mo | Medium: Pine Script, no AI scoring |
| Yahoo Finance Screener | 3–5 min | Free/delayed | Free | Low: basic filters only |
FAQ
How do I install the AI stock research tool?
Clone the open-source repo, install Python 3.10+, and add your broker API keys. Most tools include a setup script that handles dependencies in under five minutes. No coding required for basic use.
What data sources does it use for signal strength?
The default model pulls real-time prices, news sentiment (from RSS feeds), and analyst revisions. You can swap in alternative sources like short interest or options flow by editing the config file.
Can I backtest the signal strength rankings?
Yes. Export the ranked lists to CSV and use backtesting libraries like Backtrader or Zipline. Most users see a 10–15% improvement in win rate compared to manual picks.
Does it work with crypto or forex?
Some forks support crypto and forex by adding exchange APIs. The core logic remains the same: fetch data, score by **signal strength**, and rank. Check the repo’s README for supported markets.
How do I avoid false signals?
Combine **signal strength** with volume filters and trend confirmation. For example, only trade stocks with a score >70 and 20-day volume >500k shares. This reduces whipsaws in choppy markets.
“`html
Advanced Workflow: From Raw Data to Trade Signals in 60 Seconds
Once you’ve replaced your morning stock research with AI, the next step is automating the entire pipeline—from raw market data to actionable trade signals. Here’s how to build a **high-frequency research loop** that runs before the opening bell.
Start by setting up a **real-time data feed** using Polygon.io or Alpha Vantage. These APIs offer free tiers (5 requests/minute) and can push live price, volume, and news sentiment directly into your AI tool. Use the following Python snippet to fetch pre-market movers:
import requests
url = "https://api.polygon.io/v2/snapshot/locale/us/markets/stocks/gainers?apiKey=YOUR_KEY"
response = requests.get(url).json()
top_movers = [stock["ticker"] for stock in response["tickers"][:5]]
Next, feed this data into a **multi-model AI stack**. Combine a fine-tuned LLM (like Llama 3.1) for qualitative analysis (earnings call transcripts, SEC filings) with a lightweight ML model (e.g., Scikit-learn) for quantitative signals (RSI, MACD, volume spikes). Tools like LangChain can orchestrate this workflow in a single script.
Key Automation Steps:
- Pre-market screening: Filter stocks with >5% pre-market volume spikes and >2% price movement.
- Sentiment overlay: Scrape Benzinga headlines and run them through a Hugging Face sentiment model (e.g.,
finiteautomata/bertweet-base-sentiment-analysis). - Technical confluence: Use TA-Lib to calculate 5-minute moving averages and Bollinger Bands. Flag stocks where price crosses the upper band with high volume.
- Risk scoring: Assign a 1-10 risk score based on volatility (ATR), short interest, and upcoming earnings dates.
For execution, pipe the final signals into a **TradingView alert** or a broker API (e.g., Interactive Brokers). Use the following Pine Script snippet to auto-plot AI-generated support/resistance levels:
//@version=5
indicator("AI Levels", overlay=true)
support = input(420.69, "AI Support")
resistance = input(435.50, "AI Resistance")
hline(support, "Support", color=color.green)
hline(resistance, "Resistance", color=color.red)
Troubleshooting tip: If your AI outputs are inconsistent, check for data drift. Market regimes shift (e.g., from bull to bear), and static models degrade. Retrain your ML model weekly using this free guide on backtesting with Backtrader. For LLMs, use prompt chaining to validate outputs—ask the model to “explain its reasoning” before generating a final signal.
Finally, log every trade signal in a **Notion database** or Google Sheet. Track accuracy over time and adjust your AI’s confidence thresholds. Most retail traders see a 15-20% improvement in win rate after 30 days of iterative tuning.
“`
Final Verdict
If you spend more than 30 minutes daily on stock research, the **AI stock research** agent is a no-brainer. It cuts prep time to under a minute, replaces gut calls with data-driven rankings, and scales from side hustles to small funds.
Start with the open-source version, connect your broker API, and run a week of parallel tests. Most traders see a 50% reduction in research time and a 10–20% boost in win rate. For advanced setups, check our free guides on backtesting and custom scoring models.
Reclaim your mornings—let the AI do the heavy lifting.